Skip to content
  • Kampala & Fort Portal
  • admin@opendata-analytics.org
Facebook X-twitter Linkedin
  • Home
  • About Us
  • Cleaned Data Sets
    • Health Data Sets
    • Economic Development Data Sets
    • Education Data Sets
    • Agriculture Data Sets
  • Visualisations
    • Health Data
    • Education Data
    • Economic Data
    • Cities’ Revenue Mobilisation Data
  • Data Insights
    • Cities’ Data Stories
logo Open Data transperant
Contact Us
Click on the Edit Content button to edit/add the content.

Category: Revenue Visualisations

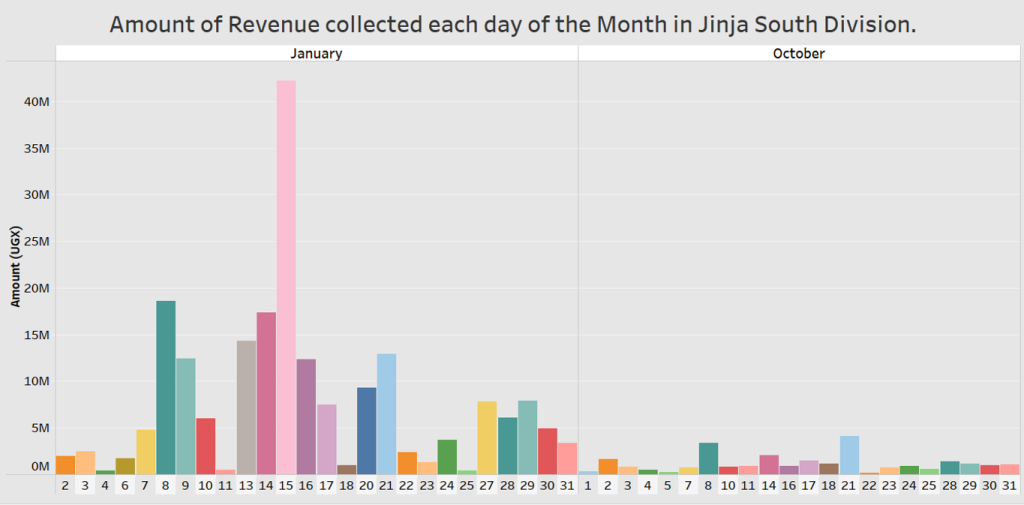
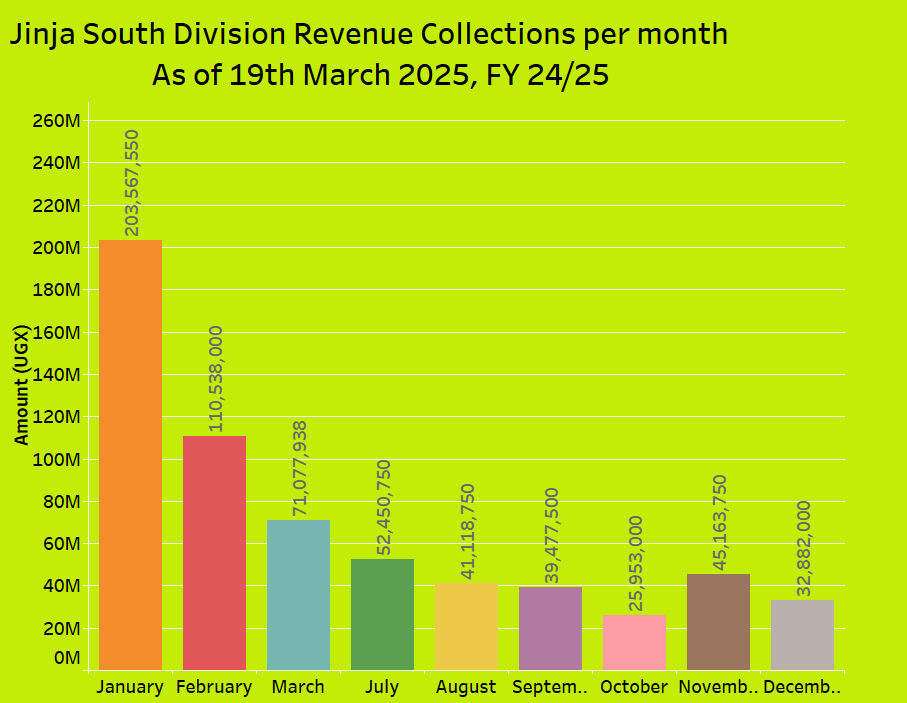
Jinja South division’s best and worst revenue collection months as of 19 March 2025: January and October respectively.
Jinja South Division Revenue Collections per month As of 19th March 2025, FY 24/25
Jinja North Division Revenue collected from Trading License per month each financial year.

Fort Portal City Street Parking Data Analysis: Number of Vehicles parked on each street from July 2023 – February 2024.
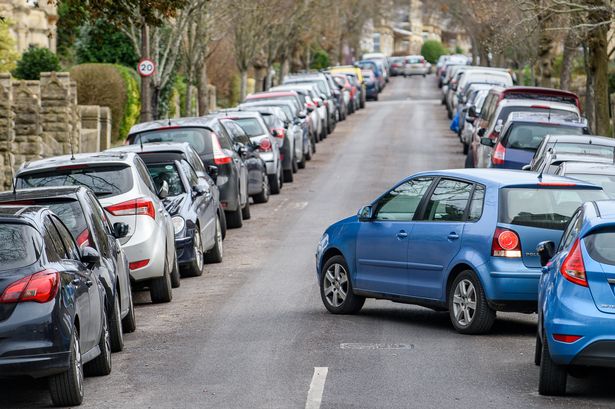
Read full Analysis presentation here.

Jinja City – North Divison’s Revenue Collected from Trading Licenses for each Financial Year
Empowering Sustainable Development Through Data-Driven Insights.

  • admin@opendata-analytics.org

Quick Links

  • Home
  • About Us
  • Insights
  • Contact Us

Cleaned Data Sets

  • Health Data Sets
  • Economic Development Data Sets
  • Education Data Sets
  • Agriculture Data Sets
Subscribe Our Newsletter

Stay Informed with the Latest Insights from Open Data Analytics (ODA)

All Rights Reserved - Open Data Analytics ©️2026
Facebook X-twitter Linkedin